07/06/2026 06:43am
Golang The Series EP 133: Mastering Real-time Analytics & Metrics Streaming in Go
#Redis Streams
#Data Streaming
#Real-time Analytics
#Golang
Welcome back, Gophers! In a world where data is the new oil, waiting for an end-of-day report is no longer enough. If you can observe user behavior, transaction volumes, or system health second-by-second, you gain the power to make business decisions or fix technical glitches faster than the competition.
Today, we are building a high-performance Streaming Pipeline with Go to handle a massive "Data Firehose" without breaking a sweat.
1. From Batch Processing to a Streaming Mindset
Traditionally, we saved data to a database first and then ran scripts to summarize it later (Batch Processing). In Real-time Analytics, we process data while it is "moving" (Data-in-Motion):
- Low Latency: Data must be analyzed and visualized within milliseconds or seconds.
- High Throughput: Must handle millions of events (e.g., logs from thousands of servers) simultaneously.
- The Windowing Concept: Summarizing data based on time intervals, such as "What is the total purchase volume in the last 5 minutes?"
2. The Streaming Pipeline Architecture
To ensure Horizontal Scalability, we design the system using a Decoupled approach:
- Producers (Go Apps): Capture events (e.g., User Clicks, Payments, System Metrics) and dispatch them immediately.
- Message Broker (The Buffer): Use Kafka, Redis Streams, or NATS JetStream to buffer data, preventing the downstream system from crashing during traffic spikes (Backpressure Handling).
- Processors (Go Consumers): The "brain" of our operation. These workers pull data from the broker to calculate, clean, or categorize it.
- Time-series Storage: Store the processed results in specialized databases like InfluxDB, ClickHouse, or TimescaleDB.
- Visualization: Display results via Grafana or push them through WebSockets (from EP 130) back to the user's dashboard.
3. Implementation: Building a Go Analytics Producer
In Go, we utilize Goroutines to ensure that sending metrics doesn't block the main application logic.
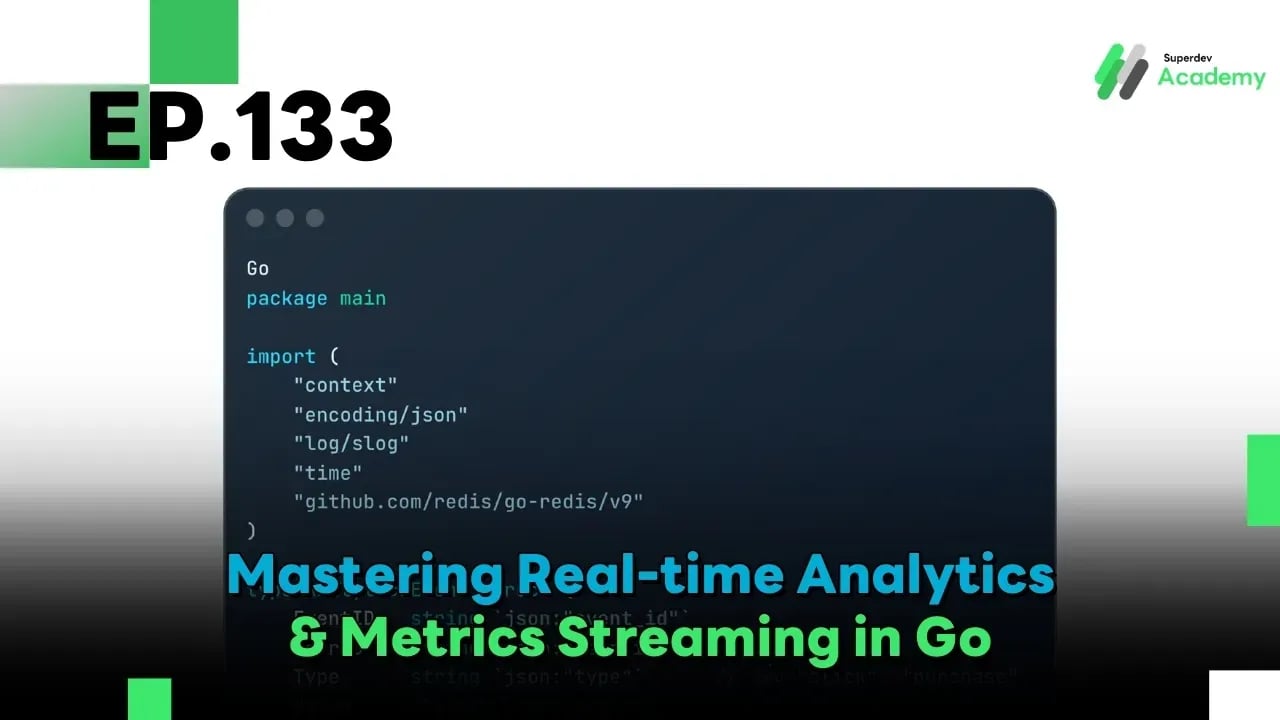
Example: Streaming Events to Redis Streams
Go
package main

import (
	"context"
	"encoding/json"
	"log/slog"
	"time"

	"github.com/redis/go-redis/v9"
)

type AnalyticsEvent struct {
	EventID   string  `json:"event_id"`
	UserID    string  `json:"user_id"`
	Type      string  `json:"type"` // e.g., "click", "purchase"
	Value     float64 `json:"value"`
	Timestamp int64   `json:"timestamp"`
}

func streamEvent(rdb *redis.Client, event AnalyticsEvent) {
	ctx := context.Background()
	data, _ := json.Marshal(event)

	// Use Redis Streams (XAdd) for ordered event logging
	err := rdb.XAdd(ctx, &redis.XAddArgs{
		Stream: "stream:user_analytics",
		MaxLen: 100000, // Retain the last 100k events to optimize RAM
		Approx: true,
		Values: map[string]interface{}{
			"payload": data,
		},
	}).Err()

	if err != nil {
		slog.Error("Streaming error", "error", err)
	}
}
4. The Processor (Worker Pool Pattern)
To keep up with the incoming stream, we use a Worker Pool to process messages concurrently:
Go
func startProcessor(rdb *redis.Client) {
	for {
		// Read new data from the stream (Blocking Read)
		streams, err := rdb.XRead(context.Background(), &redis.XReadArgs{
			Streams: []string{"stream:user_analytics", "$"},
			Block:   0,  // Block indefinitely until new data arrives
			Count:   10, // Process in batches of 10
		}).Result()

		if err != nil {
			continue
		}

		for _, stream := range streams {
			for _, msg := range stream.Messages {
				// Dispatch to a worker Goroutine for processing
				go processMessage(msg.Values["payload"].(string))
			}
		}
	}
}
5. Choosing the Right Storage: Time-series & OLAP
Relational Databases (MySQL/Postgres) are often too slow for millions of rows per minute. We need specialized tools:
- InfluxDB: Best for system metrics (CPU, RAM, Latency).
- ClickHouse (Recommended for Big Data): A columnar database capable of calculating sums or averages across billions of rows in milliseconds.
- Windowing Strategies:
- Tumbling Window: Non-overlapping time blocks (e.g., every 5 minutes).
- Sliding Window: A moving window that calculates data for the last X minutes relative to the current second.
6. Real-time Visualization (The Last Mile)
Once the processor has the result (e.g., total sales exceeding a threshold), we can:
- Push via WebSocket: Revisit EP 130 to update numbers on an admin dashboard instantly without a page refresh.
- Grafana Integration: Connect ClickHouse directly to Grafana to observe real-time trends via beautiful, actionable graphs.
Summary
Real-time Analytics & Metrics Streaming isn't just about showing pretty numbers on a screen; it's about giving your system "eyes." By leveraging the speed of Go and robust brokers like Redis Streams or Kafka, you can transform a chaotic data firehose into a strategic advantage.
Next Episode (EP 134): We shift our focus to heavy-duty protection with Security Hardening & Vulnerability Scanning for Go Applications. How do we ensure that the systems we've built remain safe from hacks and vulnerabilities? Don't miss it!