07/06/2026 06:43am
Golang The Series EP 134: Load & Stress Testing WebSockets with k6
#Golang
#WebSocket
#k6
#Load Testing
#Stress Testing
Welcome back, Gophers! Many developers confidently claim, "My code is well-written; it will scale effortlessly." However, in production, WebSocket servers often reveal strange behaviors under heavy traffic—Memory Leaks, File Descriptor exhaustion, or Goroutine stalemates that can bring your entire system to a halt.
Today, we step into the role of the "Destroyer" to prove whether the systems we’ve built since EP 1 are truly resilient or if they will crumble under the weight of a traffic storm.
1. Load, Stress, and Soak Testing: What’s the Difference?
Before we start "attacking" our system, we must define our objectives clearly:
2. Instrumenting Your Go Server for Testing
To effectively test, we must be able to "see" the internal state of the server while it is under fire. We use the runtime package and prometheus to track health metrics.
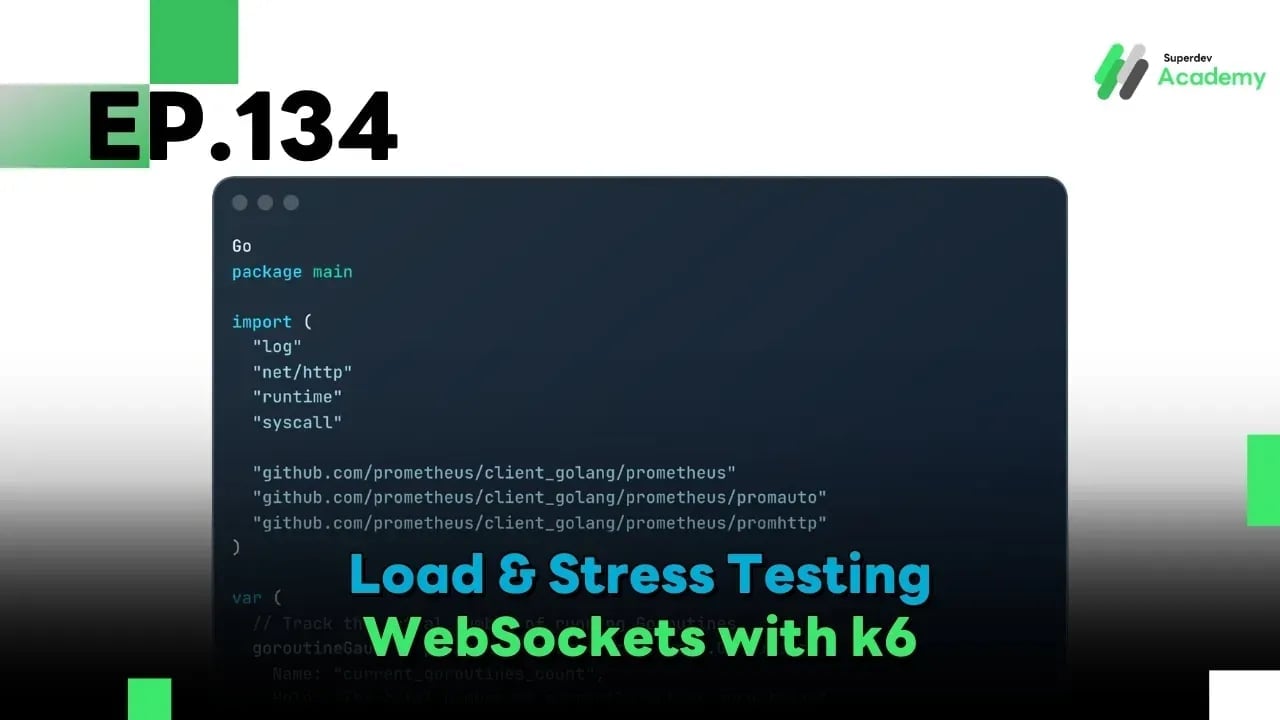
Go Code: Instrumentation & Resource Awareness
Go
package main

import (
	"log"
	"net/http"
	"runtime"
	"syscall"

	"github.com/prometheus/client_golang/prometheus"
	"github.com/prometheus/client_golang/prometheus/promauto"
	"github.com/prometheus/client_golang/prometheus/promhttp"
)

var (
	// Track the actual number of running Goroutines
	goroutineGauge = promauto.NewGauge(prometheus.GaugeOpts{
		Name: "current_goroutines_count",
		Help: "The total number of currently active goroutines",
	})
)

func main() {
	// 1. Check System Limits (File Descriptors)
	var rLimit syscall.Rlimit
	if err := syscall.Getrlimit(syscall.RLIMIT_NOFILE, &rLimit); err == nil {
		log.Printf("System-level File Descriptor Limit: %d", rLimit.Cur)
	}

	// 2. Expose Metrics for Prometheus/Grafana (Port 2112)
	go func() {
		http.Handle("/metrics", promhttp.Handler())
		log.Println("Metrics endpoint available on :2112/metrics")
		http.ListenAndServe(":2112", nil)
	}()

	// 3. Monitor Goroutine count in the background
	go func() {
		for {
			goroutineGauge.Set(float64(runtime.NumGoroutine()))
		}
	}()

	// Your WebSocket Server Logic goes here...
}
3. Designing the Attack: Scripting with k6
For WebSocket testing, we recommend k6 (by Grafana). It uses a Go-powered engine but allows you to script scenarios in JavaScript, making it incredibly flexible.
k6 Script Example (JavaScript):
JavaScript
import ws from 'k6/ws';
import { check, sleep } from 'k6';

export const options = {
  stages: [
    { duration: '1m', target: 5000 },  // Ramping up: 0 to 5,000 users in 1 min
    { duration: '3m', target: 5000 },  // Sustained: Hold at 5,000 users
    { duration: '1m', target: 0 },     // Ramping down: Gradually release
  ],
};

export default function () {
  const url = 'ws://localhost:8080/ws';

  const res = ws.connect(url, null, function (socket) {
    socket.on('open', () => {
      // Simulate sending a heartbeat or chat every 10 seconds
      socket.setInterval(() => {
        socket.send(JSON.stringify({ type: 'ping', payload: 'Gopher-Check' }));
      }, 10000);
    });

    socket.on('message', (data) => {
      // Verify that the server responds correctly
      check(data, { 'message received': (d) => d.length > 0 });
    });

    // Simulate user session duration (Stay for 60 seconds)
    socket.setTimeout(() => {
      socket.close();
    }, 60000);
  });

  check(res, { 'status is 101 (Switching Protocols)': (r) => r && r.status === 101 });
}
4. Key Metrics to Watch
While k6 is bombarding your system, keep your eyes on your Prometheus Dashboard:
- Goroutine Count: If users disconnect but the Goroutine count stays high, you have a Goroutine Leak (usually caused by unclosed channels or infinite loops).
- RSS (Resident Set Size): If memory usage keeps climbing and never settles, you have a Memory Leak.
- Handshake Error Rate: High error rates during the 101 Switching Protocols phase indicate that your Load Balancer or Handshake logic is overwhelmed.
- File Descriptors: Monitor process_open_fds. If it hits the OS limit (ulimit), new connections will be rejected immediately.
5. Tuning Your System for High Concurrency
If your system breaks at 5,000 connections and you need to reach 100,000:
- Adjust ulimit: In Linux, 1 WebSocket = 1 File. If your limit is set to 1,024, the 1,025th user will fail. Increase it to 100,000+ in /etc/security/limits.conf.
- Buffer Management: Ensure you are using sync.Pool (from EP 132) to reuse memory buffers during message processing to reduce GC pressure.
- TCP Tuning: Adjust tcp_fin_timeout and tcp_tw_reuse at the OS level to recycle sockets faster.
Summary
Load & Stress Testing isn't just about finding out "how much it can take." It's about building confidence. When that massive traffic spike hits in the middle of the night, you will stand firm, knowing exactly how your system will behave and having a failover plan already in place.
In the Next Episode (EP 135): We will integrate this battle-tested system into a Continuous Deployment & CI/CD Pipeline, ensuring that every update is delivered automatically and safely. Don't miss it!