07/06/2026 06:43am
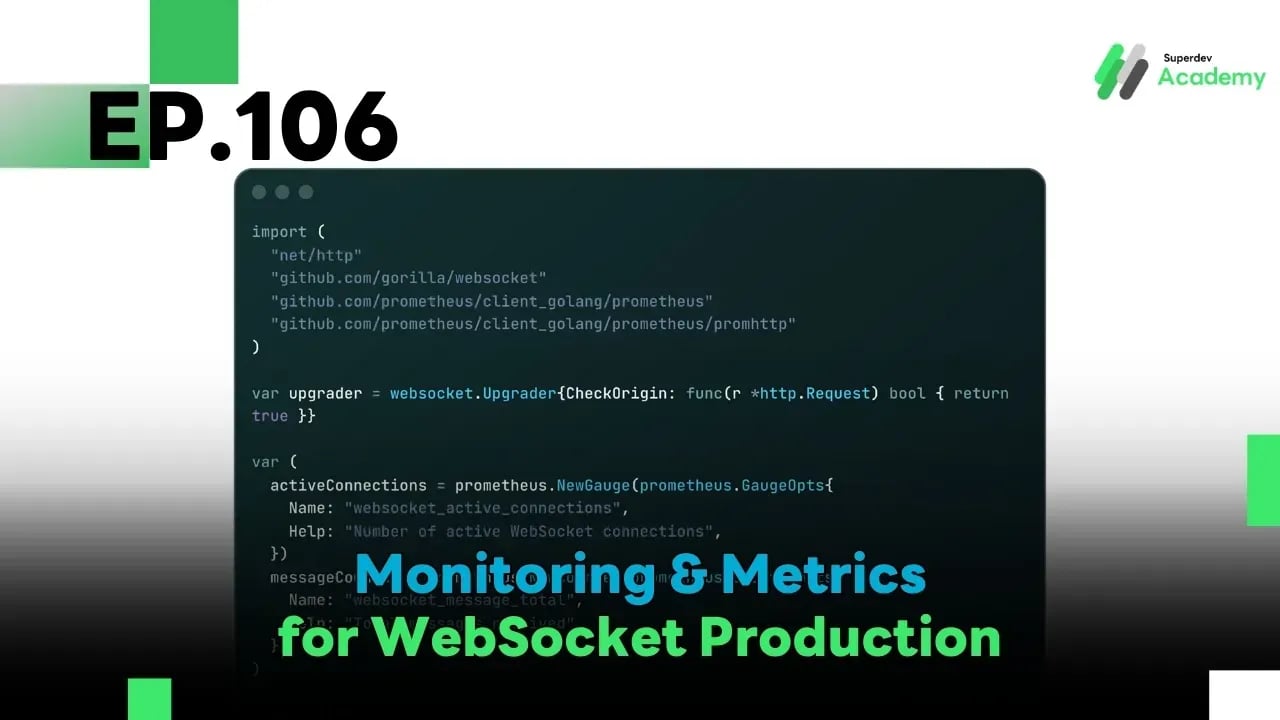
EP.106 Monitoring & Metrics for WebSocket Production
#Real-time System
#Metrics
#Production
#Go
#Grafana
#Prometheus
#Monitoring
#WebSocket
When your WebSocket Server enters the production level, looking at logs alone is no longer enough you need Monitoring & Metrics to view your system’s “health” in real time.
✅ Number of active connections
✅ Volume of sent/received messages
✅ CPU, Memory, and Bandwidth usage
✅ Disconnection rate
The most popular tools for this job are Prometheus + Grafana, which help you:
- Visualize the system overview in real time
- Detect bottlenecks before users notice
🚀 And confidently prepare for system scaling
🔹 1. Why is Monitoring important for WebSocket?
WebSocket is different from traditional HTTP — it’s a persistent connection.
Without proper monitoring, you may never know:
- Which connections are still “alive”
- Whether resources are being overused
- If the system is about to crash from unexpected traffic spikes
🔍 Examples of key metrics:
| Metric | Meaning |
|---|---|
| Active Connections | Number of currently open connections |
| Message Rate | Sent/received messages per second |
| Error Rate | Number of occurred errors |
| Connection Lifetime | Duration of each connection |
| CPU / Memory Usage | Resource usage of the server |
🧩 2. Installing Prometheus to Collect WebSocket Metrics
Prometheus pulls metrics data from endpoints like /metrics via HTTP GET.
🔧 Sample Go Code:
import (
	"net/http"
	"github.com/gorilla/websocket"
	"github.com/prometheus/client_golang/prometheus"
	"github.com/prometheus/client_golang/prometheus/promhttp"
)

var upgrader = websocket.Upgrader{CheckOrigin: func(r *http.Request) bool { return true }}

var (
	activeConnections = prometheus.NewGauge(prometheus.GaugeOpts{
		Name: "websocket_active_connections",
		Help: "Number of active WebSocket connections",
	})
	messageCounter = prometheus.NewCounter(prometheus.CounterOpts{
		Name: "websocket_message_total",
		Help: "Total messages received",
	})
)

func init() {
	prometheus.MustRegister(activeConnections)
	prometheus.MustRegister(messageCounter)
}

func handleConnection(w http.ResponseWriter, r *http.Request) {
	conn, _ := upgrader.Upgrade(w, r, nil)
	defer conn.Close()

	activeConnections.Inc()
	defer activeConnections.Dec()

	for {
		_, msg, err := conn.ReadMessage()
		if err != nil {
			break
		}
		messageCounter.Inc()
	}
}

func main() {
	http.HandleFunc("/ws", handleConnection)
	http.Handle("/metrics", promhttp.Handler())
	http.ListenAndServe(":8080", nil)
}
🧭 3. Visualizing Metrics with Grafana
Grafana is a powerful visualization tool that easily connects to Prometheus.
🔍 Recommended Dashboards:
- 📊 Active Connections (Real-time Graph)
- 🔄 Message Rate (sent/received per second)
- ⚠️ Error Rate (Pie Chart)
- 💻 CPU / Memory Usage (Stacked Graph)
📈 These dashboards help you:
- Instantly spot bottlenecks
- Make accurate scaling decisions
⚙️ 4. Key Metrics for Production Systems
| Category | Metric | Purpose |
|---|---|---|
| Performance | Message rate | Detect latency/load issues |
| Reliability | Connection errors | Prevent crashes |
| Resource | CPU/Memory usage | Control resource consumption |
| Scalability | Connection count | Plan for scaling |
| Stability | Uptime / Reconnect | Indicate system stability |
🧠 5. Best Practices for Monitoring in Production
✅ Separate metrics by instance / region → for accurate load analysis
✅ Set alert rules (e.g., Active Conn. > 10,000)
✅ Track daily trends → to prevent silent system failure
✅ Store logs alongside metrics → for precise cross-analysis
🚀 Challenge!
Just by adding a /metrics endpoint and connecting Grafana, you’ll instantly see every behavior of your WebSocket Server in real-time — helping you:
- Troubleshoot faster
- Confidently scale your system
- Build a production-ready system 🔧
🌟 Next EP:
📘 EP.107: Profiling and Benchmarking WebSocket Server
A deep dive into measuring WebSocket performance using pprof, wrk, and hey, along with real-world optimization techniques for production systems! ⚡
Read more
🔵 Facebook: Superdev Academy
🔴 YouTube: Superdev Academy
📸 Instagram: Superdev Academy
🎬 TikTok: https://www.tiktok.com/@superdevacademy?lang=th-TH
🌐 Website: https://www.superdevacademy.com/en