07/06/2026 06:43am
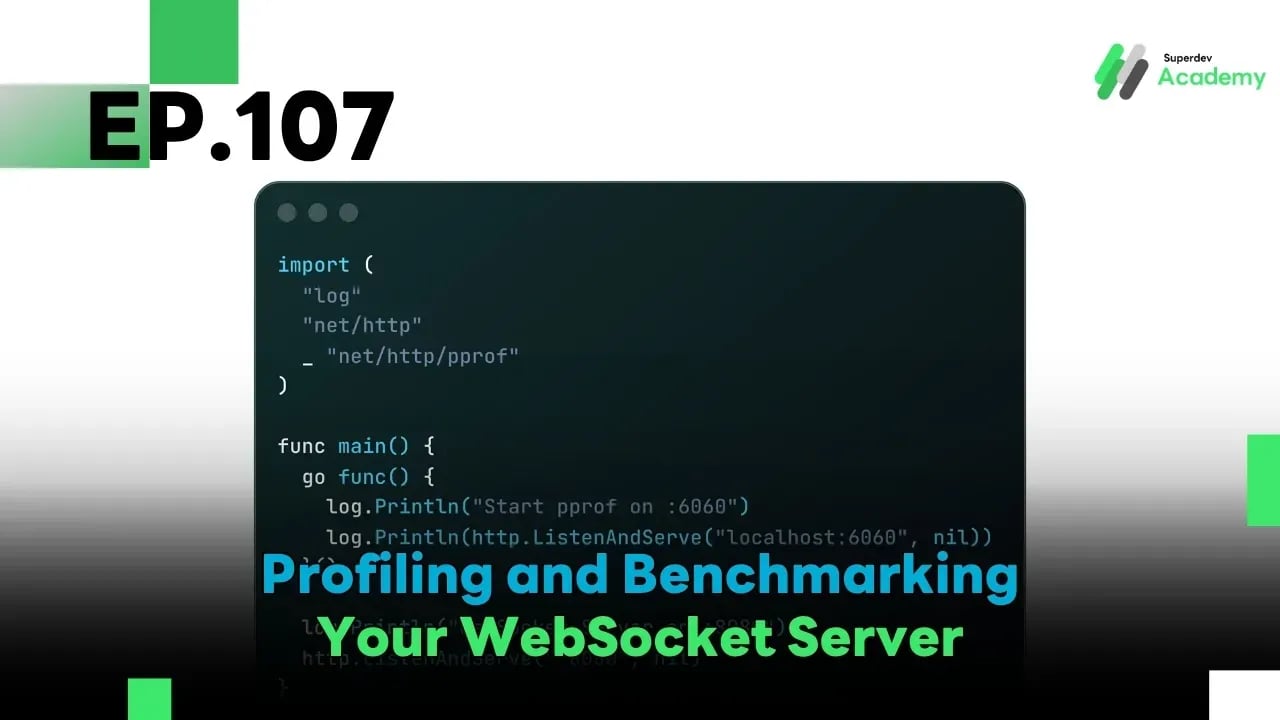
EP.107 Profiling and Benchmarking Your WebSocket Server
#WebSocket
#Profiling
#Benchmark
#Go
#Golang
Once your WebSocket Server is production-ready, the goal is no longer just "it works" — it must be fast, stable, and efficiently use system resources. 🚀
In this episode, we’ll dive into the world of Profiling and Benchmarking to assess how well your code performs — plus techniques to optimize your server beyond its current limits!
Tools we’ll use:
🔬 pprof — Analyze CPU, memory, and goroutine usage
💣 wrk — Load testing and request throughput
⚡ hey — Latency and connection success rate testing
🧩 1. Why Do Profiling and Benchmarking Matter?
Because without measuring, you’ll never know why your code is slow.
Here’s what you can uncover:
| What to Check | Why It Matters |
|---|---|
| CPU hotspots | Optimize logic or avoid nested loops |
| High memory usage | Detect memory leaks |
| Goroutines stuck or bloated | Prevent deadlocks or panics |
| High latency | Locate processing bottlenecks |
| Max concurrent connections | Plan accurate system scaling |
🔍 2. Using pprof to Analyze Runtime Code
pprof is a built-in tool in Go that lets you inspect your system's performance in real-time.
You can expose a /debug/pprof/ endpoint and analyze it via browser or CLI.
Example code to start pprof:
import (
	"log"
	"net/http"
	_ "net/http/pprof"
)

func main() {
	go func() {
		log.Println("Start pprof on :6060")
		log.Println(http.ListenAndServe("localhost:6060", nil))
	}()

	log.Println("WebSocket Server on :8080")
	http.ListenAndServe(":8080", nil)
}
⚙️ 3. Using wrk to Test Load and Throughput
wrk is a powerful benchmark tool for firing high-volume HTTP or WebSocket requests.
Example command:
wrk -t12 -c400 -d30s http://localhost:8080/ws
| Parameter | Description |
|---|---|
-t12 | Use 12 threads |
-c400 | Simulate 400 concurrent connections |
-d30s | Run test for 30 seconds |
Output includes:
- Requests/sec
- Average Latency
- Transfer/sec
⚡ 4. Using hey to Measure Latency and Error Rate
hey is a CLI tool that helps test response time and system stability.
Install:
go install github.com/rakyll/hey@latest
Example usage:
hey -n 1000 -c 50 http://localhost:8080/ws
Output includes:
📉 Average latency
❌ Error rate
✅ Success rate
🧠 5. Optimization Techniques for Production
Once you gather performance data, use it to improve your system:
| Issue | Solution |
|---|---|
| High CPU usage | Use goroutine pool / minimize JSON parsing |
| High memory usage | Use sync.Pool for buffer reuse |
| High latency | Use binary protocol / reduce compression overhead |
| Frequent disconnects | Tune timeout & retry logic |
| Heavy GC pressure | Tweak runtime.GCPercent / check for leaks |
📊 6. Example Benchmark Summary
| Metric | Average | Good Target |
|---|---|---|
| Latency | 8.5 ms | < 10 ms |
| Throughput | 22,000 req/sec | > 20,000 |
| Memory Usage | 85 MB | < 100 MB |
| Error Rate | 0.03% | < 0.1% |
Creating a summary like this every sprint helps your team plan scaling and optimization like professionals.
🚀 Challenge Time!
✅ Enable pprof on your actual WebSocket Server
✅ Use wrk and hey to benchmark from another machine
✅ Compare results before and after optimization
✅ Create a dashboard to track benchmark changes every sprint
🌟 Next EP
📘 EP.108: Advanced Timeout and Connection Cleanup
We’ll explore techniques to handle dropped, idle, or slow connections to prevent resource leaks and ensure maximum stability in production environments. 🔧
Read more
🔵 Facebook: Superdev Academy
🔴 YouTube: Superdev Academy
📸 Instagram: Superdev Academy
🎬 TikTok: https://www.tiktok.com/@superdevacademy?lang=th-TH
🌐 Website: https://www.superdevacademy.com/en